About SAMoSA
SAMoSA Study
PEACH Research Unit is conducting the SAMoSA Study to look at the influence our living environment has on physical and mental health and well-being for persons in Halifax Regional Municipality (HRM). SAMoSA stands for Spatial Accessibility to a Multitude of Services and Amenities. To assess our living environments, this study will look at how easy or difficult it is to access the following services and amenities: healthy food outlets; green and recreational space; public transit; family doctors; affordable housing; safety from crime; and jobs.
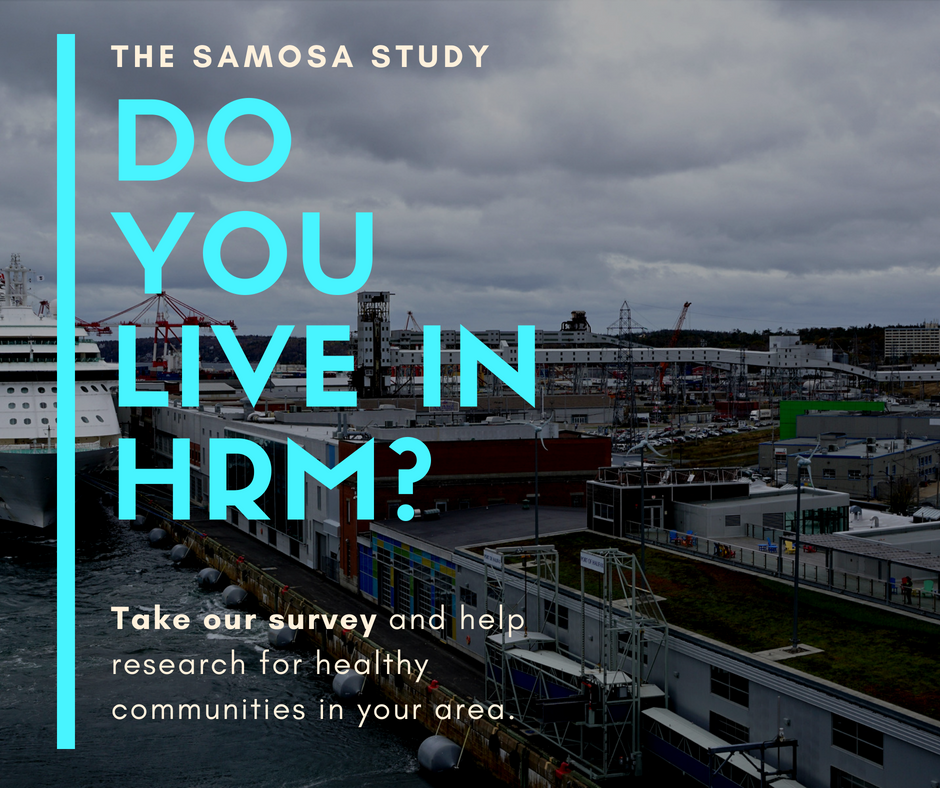
The research team conducted an anonymous online and in-person survey with responses from adult residents across HRM. Results from this study will be made available on the SAMoSA pages on this website, found using the navigational buttons at the top of this page. Interactive maps showing indicators are available through the ‘Indicators’ page. Partner Institutions include the HRM Planning and Development Department, the Nova Scotia Department of Health and Wellness, and the Maritime SPOR Support Unit.
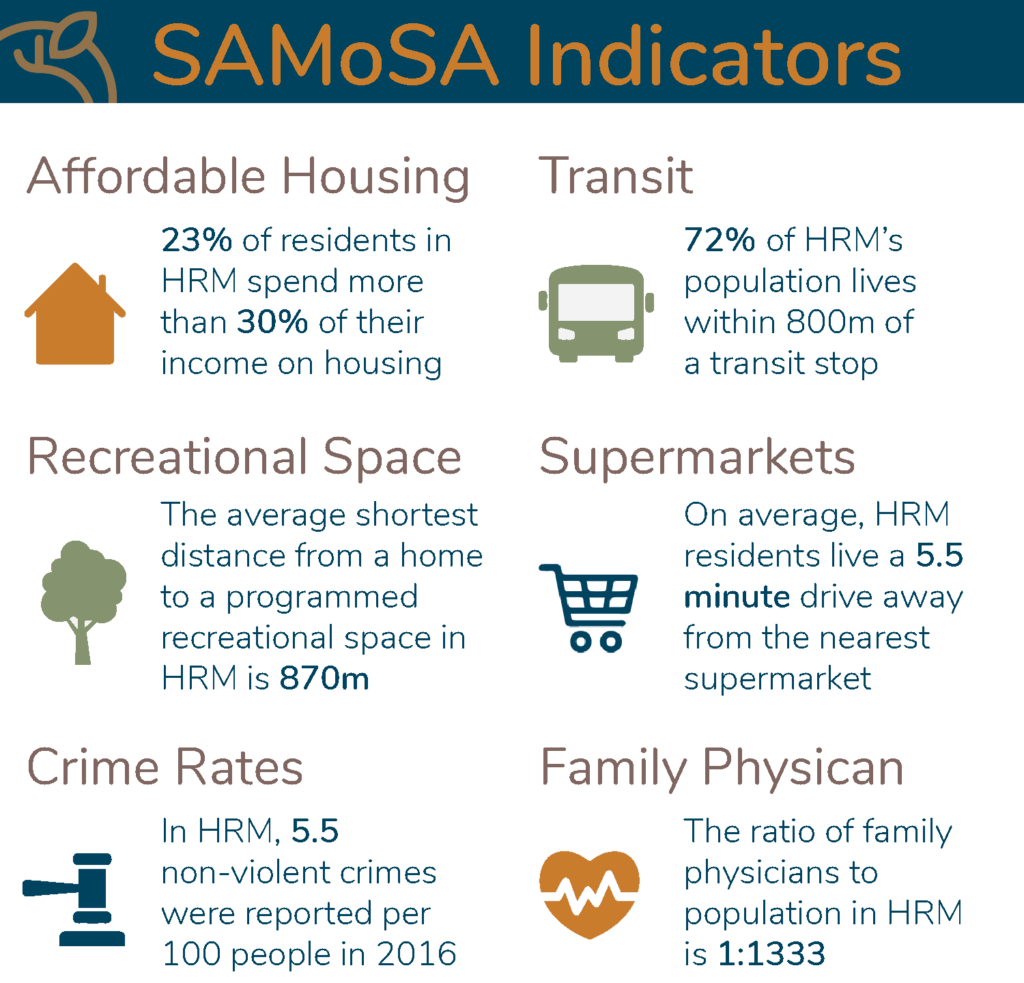
To determine the extent that the living environment influences physical and mental health and well-being of residents in Halifax Regional Municipality (HRM), the PEACH research team has been developing indicators of community characteristics. Currently, we have a set of 7 indicators:
To the right of this text is a graphic with some highlights from our findings.
The map below contains all COMe within the Halifax Regional Municipality. Clicking on a COMe will reveal its indicator scores on a spider chart below the map. The values for each indicator were each ranked on a scale of 1 to 5, with 5 being the most desirable scenario and 1 being the least desirable scenario (e.g. a score of ‘5’ for ‘Safety/Crime’ indicates lower crime rates in that neighbourhood). The larger the polygon on the spider chart, the healthier a community is overall.